
A finance team reviews printed charts and reports together around a meeting table
Data ontology accelerator

Value has a structure. AI X-Ray maps it.

It learns how your business speaks value, maps the drivers behind every result, and explains each move from verified numbers only.

Proven in the CFO office. The numbers are arithmetic, the words are AI, and your finance team agrees every check.

How it works

The business as a map, not a spreadsheet

  • Ontology and knowledge graph

    How the business makes its numbers, captured once with finance: results, drivers, and how they connect. Every figure traces to the inputs that made it, week after week.

  • Deterministic math, ten checks

    Every change is split across its drivers exactly, to the penny. No model guesses a number, and nothing is shown until it passes all 10 checks.

  • Then generative AI explains

    Only then does generative AI tell the story, in plain words, and answer questions. Ask it anything about the week; it answers from the verified numbers only.

  • The Monday briefing

    A fresh briefing every Monday morning: what helped, what hurt, and what to fix first, ranked by what the business can act on.

The numbers are arithmetic. The words are AI. They never swap roles.

An analyst works through printed reports and charts at her desk

Why it matters

Every business knows which results matter, and the answer to why they moved runs through a value chain no single team owns. AI X-Ray traces each move to its drivers, every Monday, with every figure checked against ten rules before anyone sees it.

In the CFO office

  1. MondayOperating margin is down.
  2. TuesdayFinance asks sales, operations and pricing for the breakdown.
  3. ThursdayThree teams, three spreadsheets, three answers.
  4. FridayThe explanation lands. The number has already moved again.

Today, finding out why a top-line number moved pulls three teams away from their own work, and the answer arrives after the number has moved again.

  • Late
  • Opaque to the CFO
  • Dependent on other teams
  • Out of date on arrival
Benefits

One AI analyst. Three jobs, every Monday

  • Explain

    Why the number moved, in plain words, before the meeting.

  • Verify

    Every figure checked and cited before anyone sees it.

  • Recommend

    What to fix first, ranked by what the business can act on.

  • Same engine, two altitudes

    Executives get the story; analysts get the evidence. Same engine, same numbers.

  • Your data stays with you

    AI X-Ray runs in your own cloud environment.

Product flow

Same engine, same numbers, different altitude

Who is looking today? Choose Executive or Analyst, and switch any time from the header. These are the real product screens, shown with synthetic data.

Illustrative, synthetic data
Executive

The story: what moved, why, and what to do.

The whole business tree, at a glance.

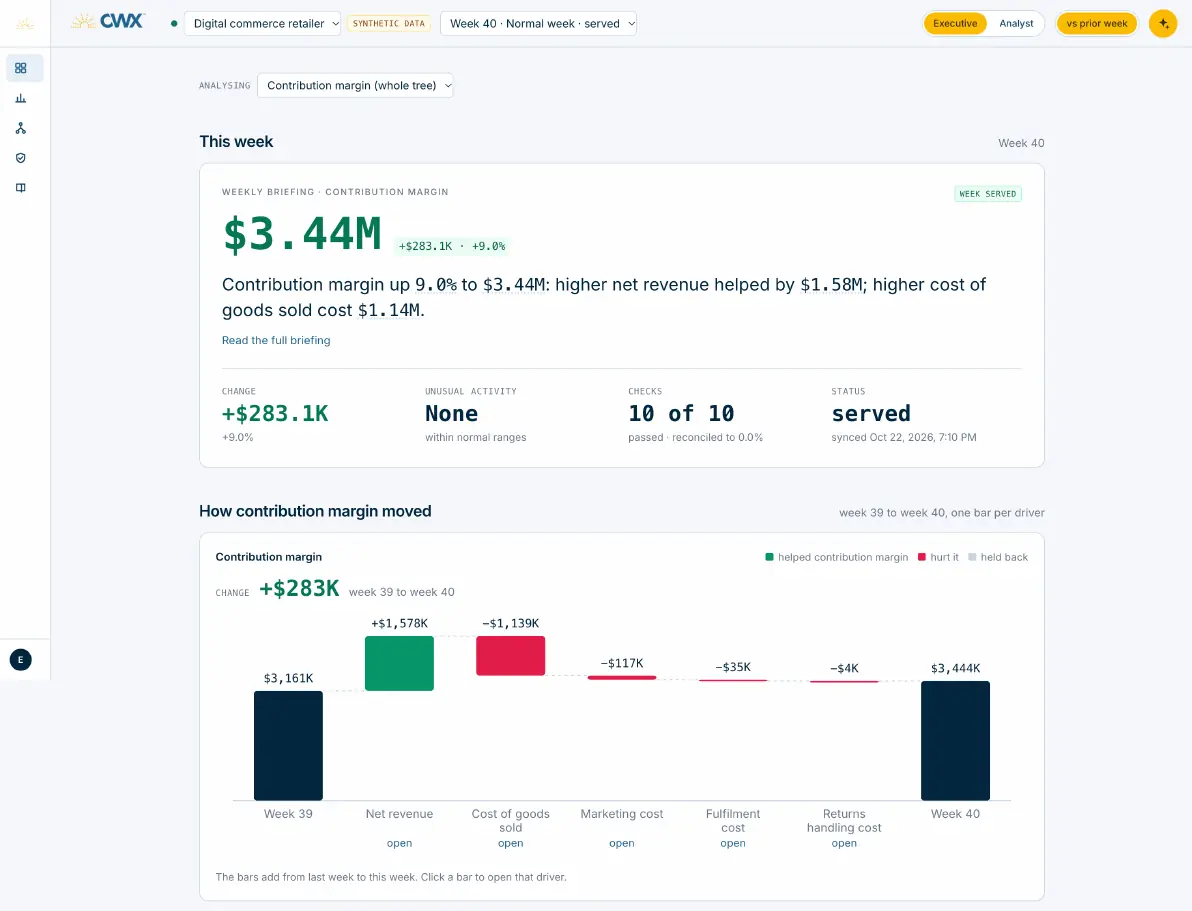
  • One cited headline and the week at a glance
  • A bridge from last week to this week that adds up
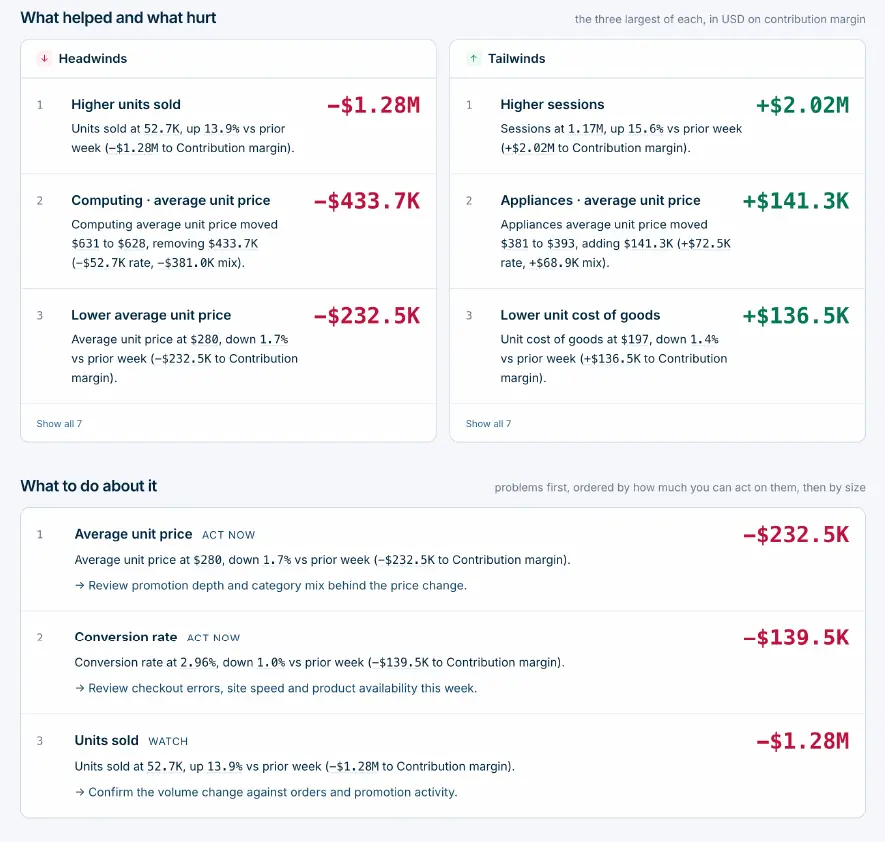
  • What to do about it, problems first
Executive view: the weekly briefing for contribution margin with its verification status, and a waterfall of how it moved from last week to this week, one bar per driver
Illustrative, synthetic data
Executive view: what helped and what hurt, as headwinds and tailwinds, then what to do about it, with actions marked act now or watch
Illustrative, synthetic data
Analyst

The evidence: every driver, every check, every number.

The nodes of your function, in full detail.

  • Full decomposition tables and methods
  • Every gate with its detail
  • The driver map and the one input file
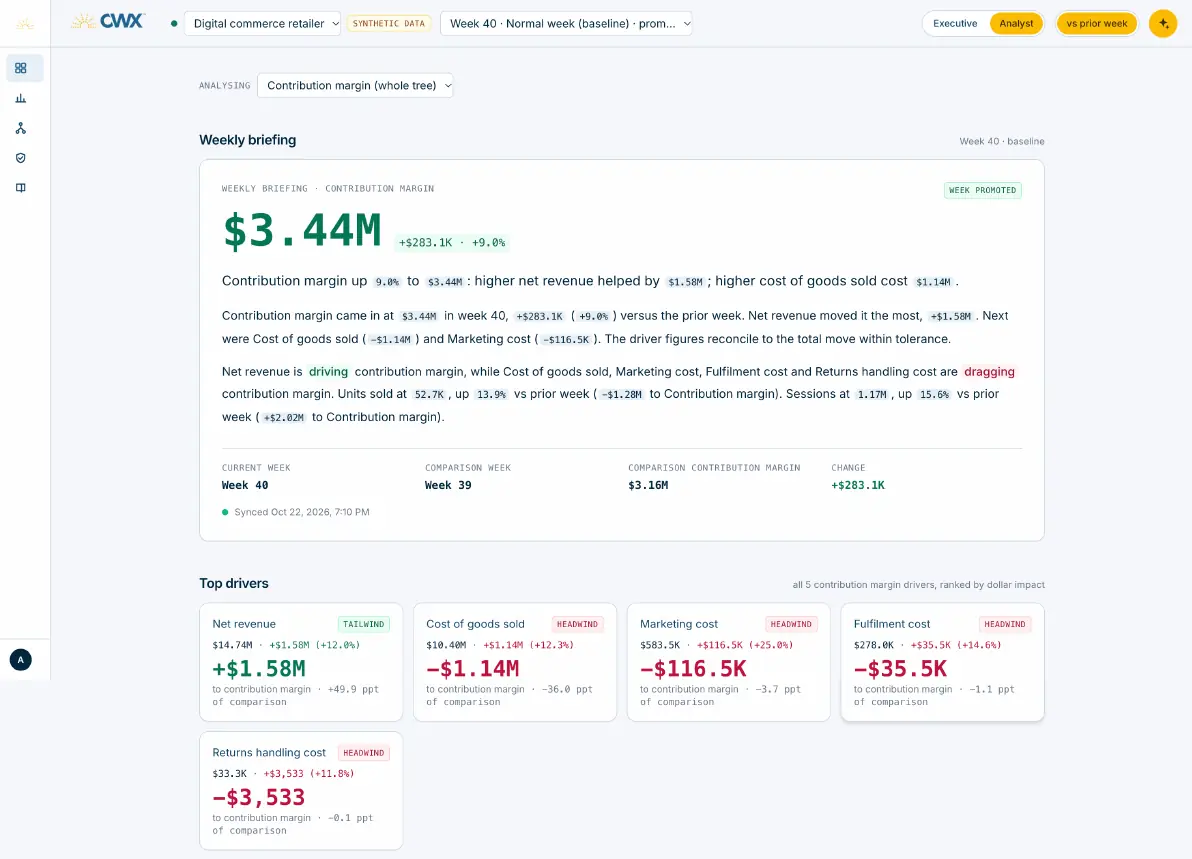
Analyst view: the weekly briefing in full, with the figures behind each sentence, and the top drivers ranked by impact
Illustrative, synthetic data
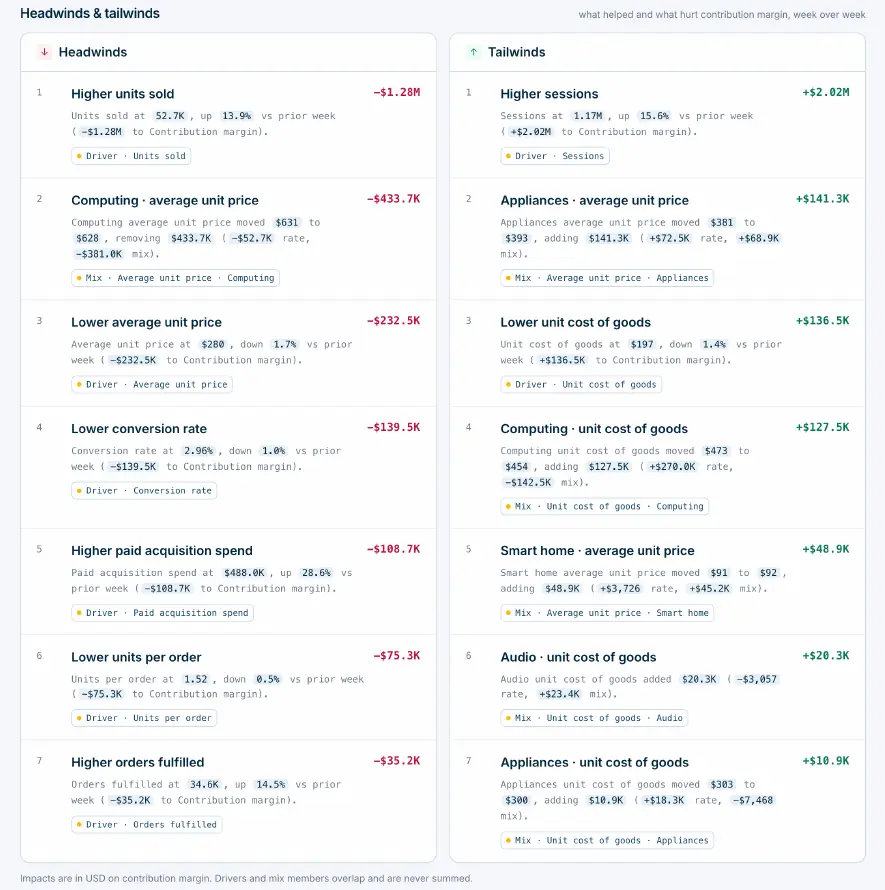
Analyst view: every headwind and tailwind, each tagged with the driver or mix it comes from
Illustrative, synthetic data
  1. 01

    Choose who is looking

    Executive for the whole business tree, or Analyst for the nodes of your function.

  2. 02

    Read the briefing

    The top number, explained in plain words, with its checks shown.

  3. 03

    See how it moved

    A bridge from last week to this week, one bar per driver, that adds up.

  4. 04

    What helped, what hurt

    Headwinds and tailwinds, then down the driver tree to the cause.

  5. 05

    What to do about it

    Recommended actions, problems first, ranked by what you can act on.

  6. 06

    Ask the assistant

    Ask a specific question in natural language and get an answer from the verified numbers, plus the next action.

Questions

Frequently asked questions

Something else on your mind? Ask us directly

  • No. The numbers are arithmetic. The words are AI. They never swap roles. Every change is split across its drivers exactly, to the penny, and reconciled to your books. Generative AI only explains, summarizes and answers questions about figures that have already passed all 10 checks.

Get started

Find out why the number moved.

Tell us the results you steer by and the questions your leadership asks. We will show you how AI X-Ray answers them.